Documentation
NOTE: We are working on extended version of this documentation. Please bear with us for the time being.General rules
- Positive signals are displayed at the bottom of the candle, with arrow pointing up. Negative signals are displayed at the top of the candle, with arrow pointing down.
- When following signals, it’s often a good idea to average in if the candle closes with long body/wick in the direction of the signal.
- Higher time frame signals take precedence over lower time frame signals.
Candle colors
| Color | Meaning |
|---|---|
Green | Price is in an uptrend |
Red | Price is in a downtrend |
Gray | Price is in consolidating period, chop zone |
Navy | Pump candle, whale manipulation, usually signals intent to mark up. However when closes with tall top wick at a key level, might signal absorption (incoming reversal) |
Maroon | Dump candle, whale manipulation, usually signals intent to mark down However when closes with tall bottom wick at a key level, might signal absorption (incoming reversal) |
Orange | Overbought, or strong bullish trend |
Olive | Extended overbought, or very strong bullish trend |
Magenta | Oversold, or strong bearish trend |
Aqua | Extended oversold, or very strong bearish trend |
Signals
| Signal | Meaning |
|---|---|
𝛃Green Beta | Bullish continuation |
𝛃Red Beta | Bearish continuation |
λLambda | Confirmed reversal to the upside (Long) |
ΣSigma | Confirmed reversal to the downside (Short) |
ΔBlue Delta | Bear weakness |
ΔGreen Delta | Bear weakness, possible reversal (stronger signal than Blue Delta) |
ΔOrange Delta | Bull weakness |
ΔRed Delta | Bull weakness, possible reversal (stronger signal than Orange Delta) |
ƱBlue Upsilon | Possible bottom |
ƱGreen Upsilon | Possible bottom (strongest signal) |
ΩOrange Omega | Possible top |
ΩRed Omega | Possible top (strongest signal) |
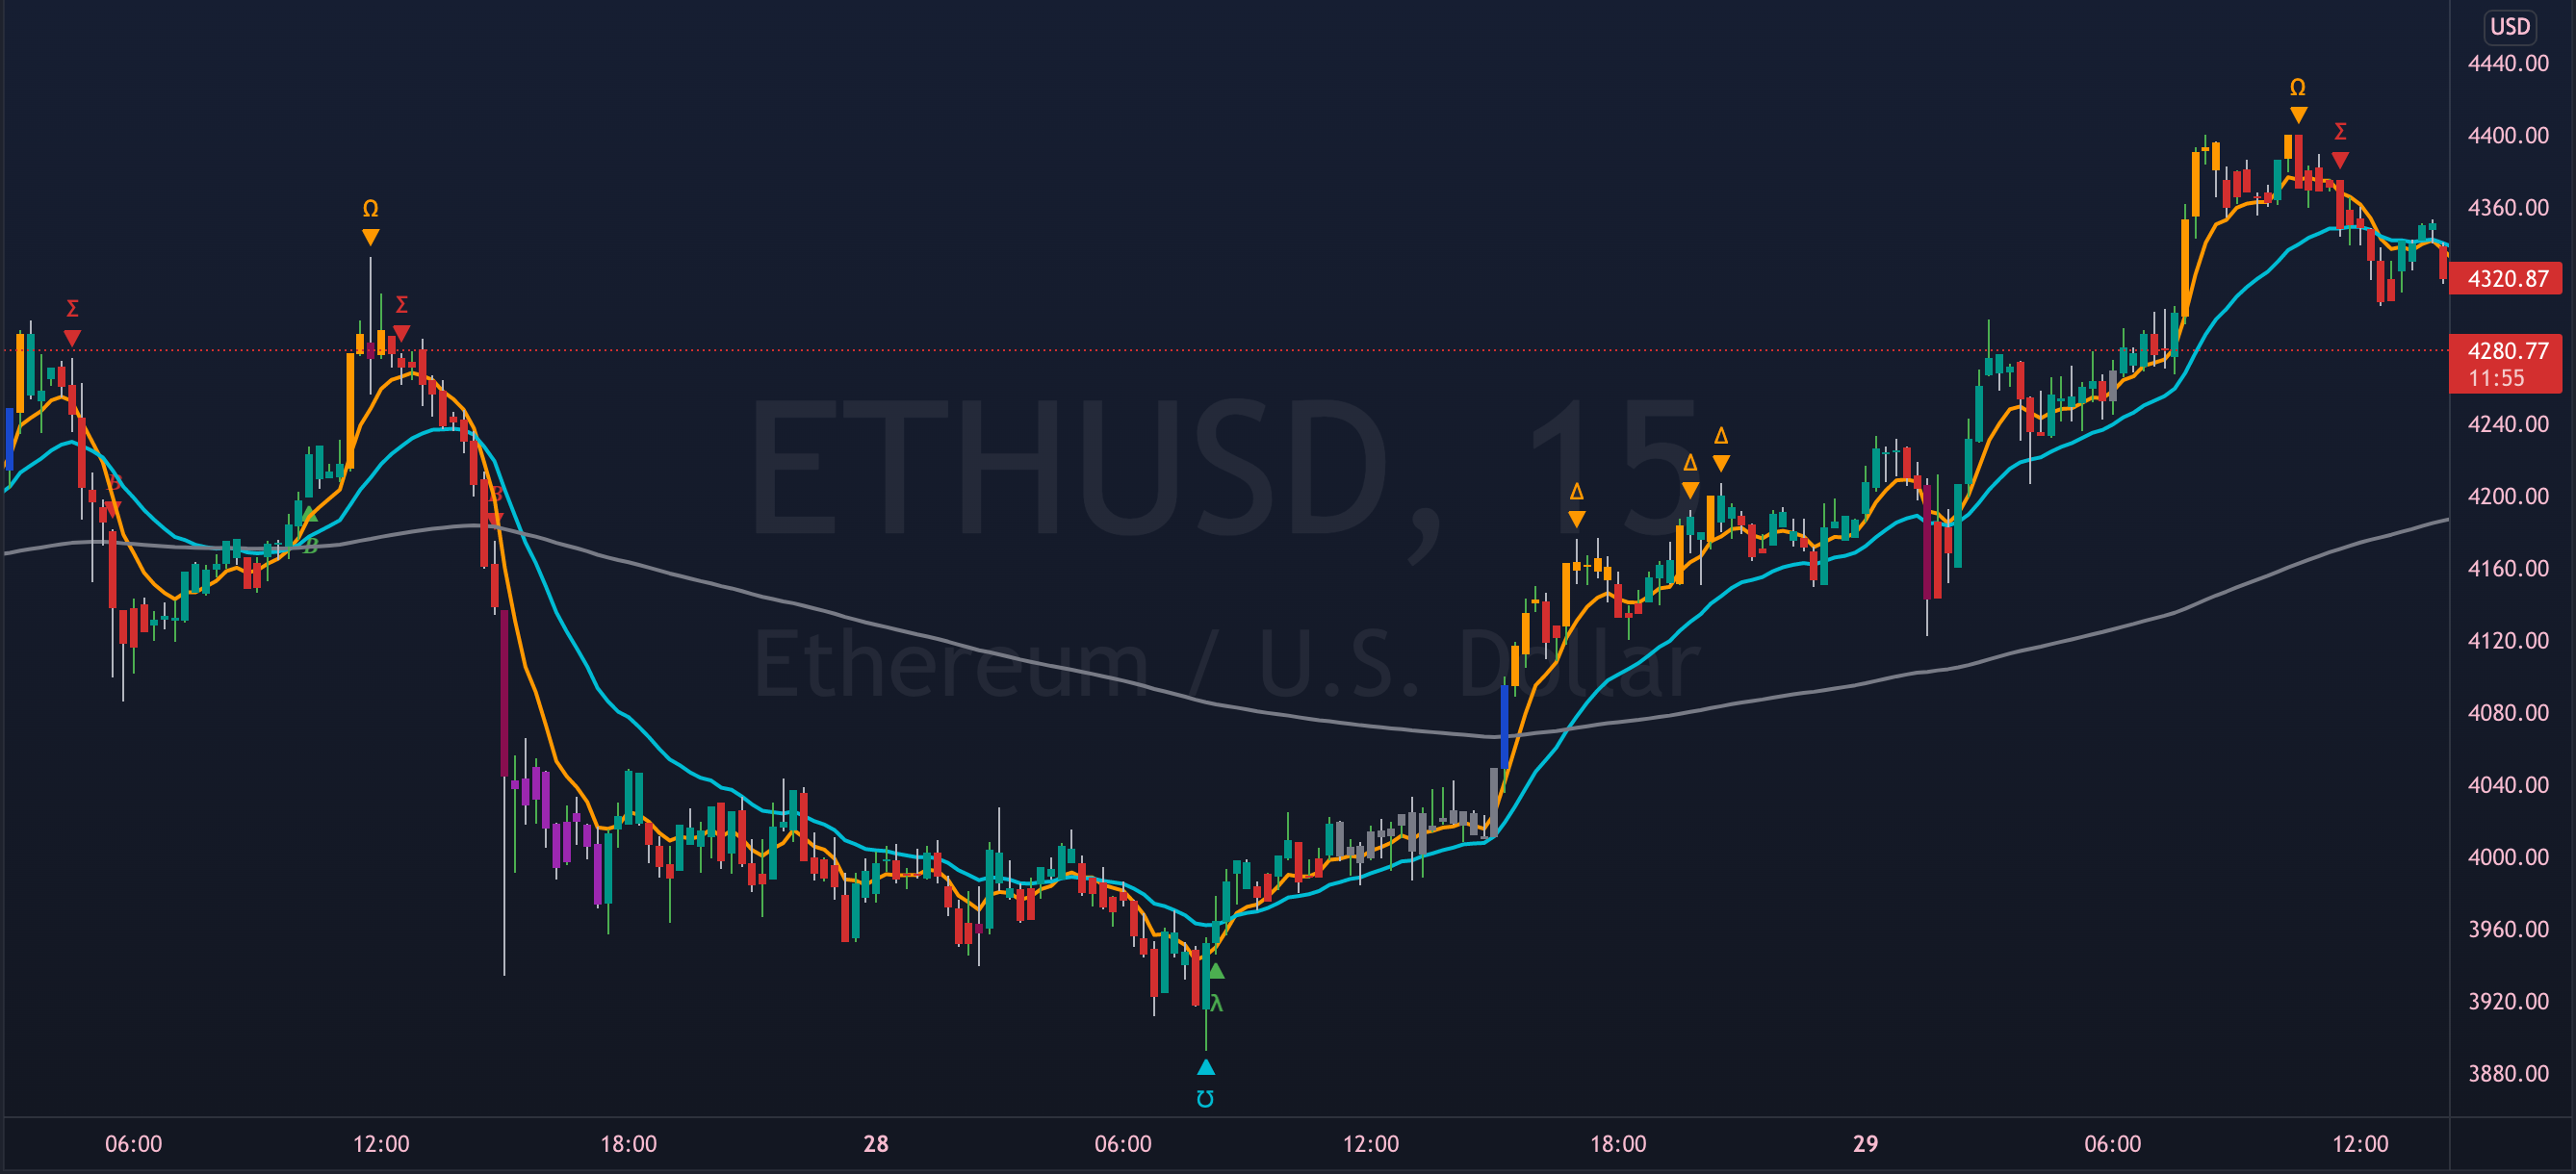
Gallery


Trade fiercely